TrajAir: A General Aviation Trajectory Dataset
This novel dataset, TrajAir, provides recorded trajectories of multiple aircraft operating around a standard non-towered airport while also providing the weather conditions during these operations. TrajAir lends well for training, testing, and benchmarking algorithms related to trajectory prediction, including socially-aware models.
Dataset
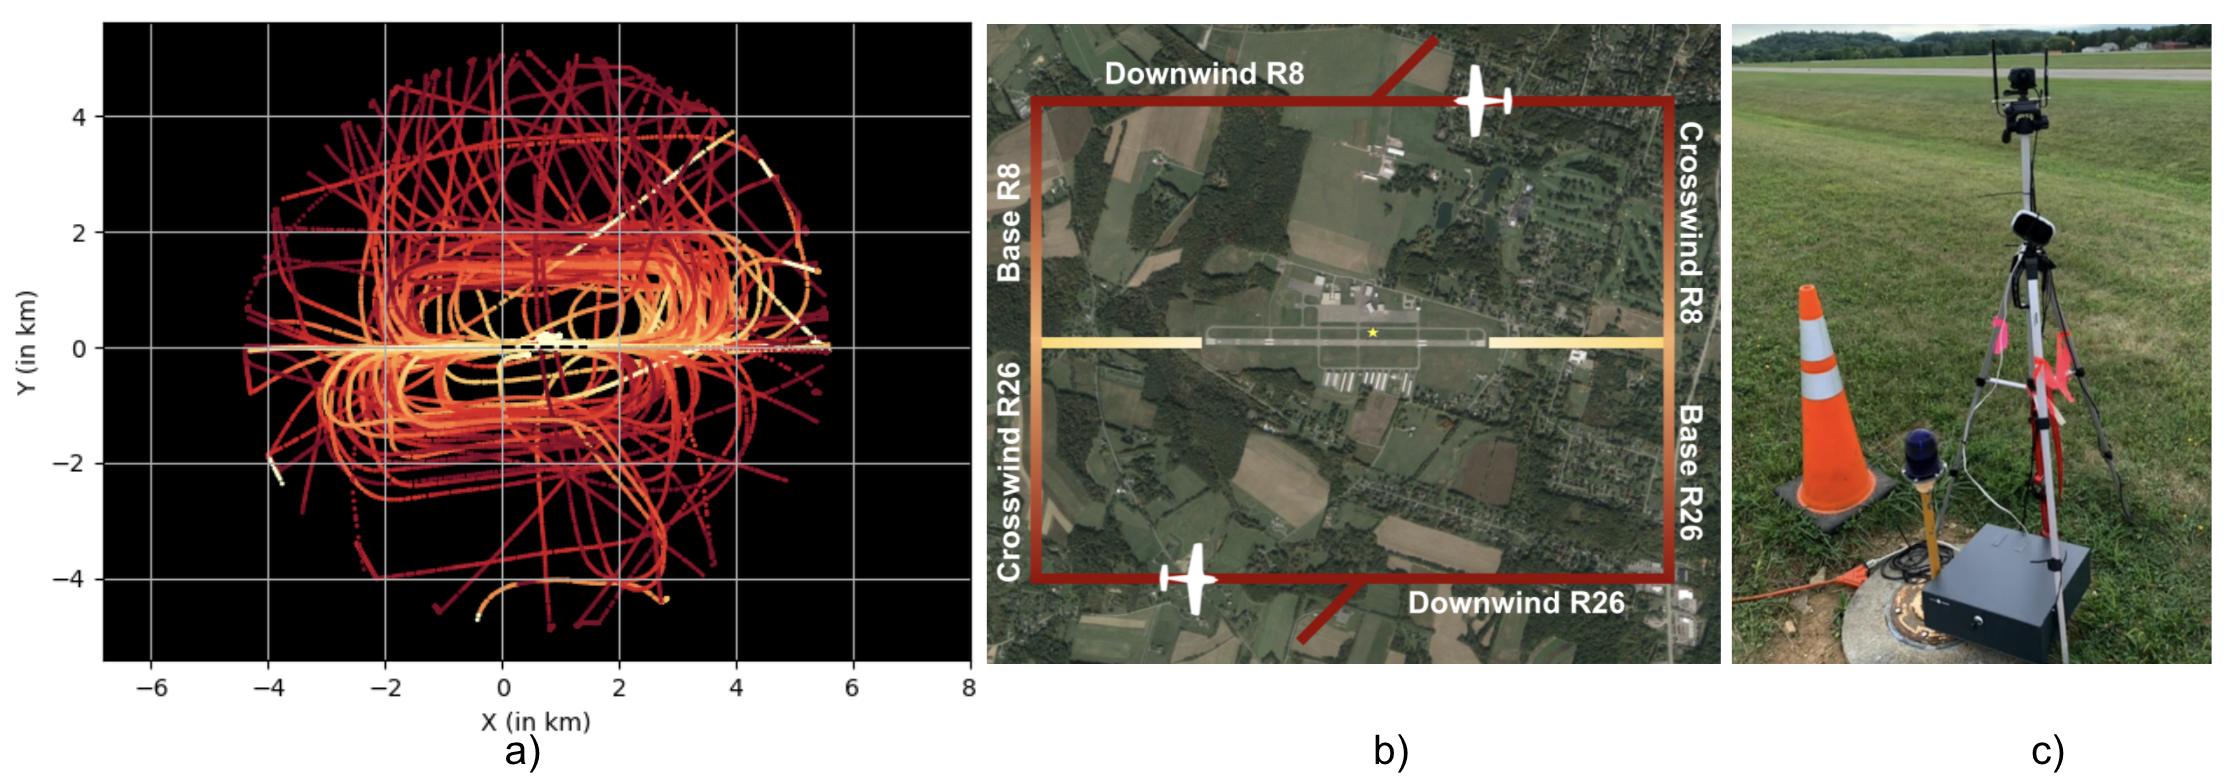
The TrajAir dataset is collected at the Pittsburgh-Butler Regional Airport (ICAO:KBTP), a single runway GA airport, 10 miles North of the city of Pittsburgh, Pennsylvania. Additional information about KBTP is available online. Aircraft entering and leaving non-towered airspace need to follow guidelines established by the FAA to ensure safety and efficiency of all participating agents. KBTP has Left Traffic patterns for both runways. These patterns are rectangular-shaped with left-handed turns relative to the direction of landing or takeoff. Figure 1 shows the traffic pattern for Runway 8 and 26 around KBTP with corresponding direction of traffic flow. Aircraft usually take-off or land into the wind and hence the nomenclature follows this sequence. When an aircraft takes-off it is on an upwind leg. A left turn puts it on a crosswind leg, followed by turns into downwind leg and base leg. The final left turn puts the aircraft on the final leg for a touch-down. FAA also establishes that an entry into the pattern should be at a 45 degree angle to the downwind leg.
The trajectory data provided spans days from 18 Sept 2020 till 23 Apr 2021 and includes a total of 111 days of data discounting downtime, repairs, and bad weather days with no traffic. Data is collected starting at 1:00 AM local time to 11:00 PM local time.
Collection Process
The dataset uses an Automatic Dependent Surveillance-Broadcast (ADS-B) receiver placed within the airport premises to capture the trajectory data. The ADS-B In receiver receives data directly broadcasted by other aircraft with ADS-B Out. For aircraft that do not have a ADS-B Out, the Traffic Information Service-Broadcast (TIS-B) takes the position and altitude of aircraft using radar and converts that information into a format that’s compatible with ADS-B. It then broadcasts the information to our receiver. The receiver uses both the 1090 MHz and 978 MHz frequencies to listen to these broadcasts. The ADS-B uses satellite navigation to produce accurate location and timestamp for the targets which is recorded on-site using our custom setup.
We also include weather data during the data collection time period for environmental context. The weather data is obtained post-hoc using the METeorological Aerodrome Reports (METAR) strings generated by the Automated Weather Observing System (AWOS) system at KBTP. We use the Iowa State METAR repository to gather all the weather data during the trajectory collection time-frame. The raw METAR string is then appended to the raw trajectory data by matching the closest UTC timestamps.
Data Processing
The data obtained from the ADS-B receiver and the METAR strings is processed to make it suitable for training networks. The following steps are performed:
- Removal of data points that have corrupt or no location fields.
- Removal of duplicate data points with the same aircraft identifier and location fields.
- Removal of data points where the altitude is more than 6000 feet and distance is more than 5 kms from one end of the runway.
- Transforming the data to a local Cartesian coordinate frame in SI units. The origin is at the end of the runway with x-axis pointing along the runway.
- Processing raw METAR strings to get wind velocity and direction along and across the runway in the local Cartesian frame in SI units.
- Interpolating trajectory data every second for all agents using a cubic interpolation strategy.
- Segmenting the data into “scenes” with at least one active aircraft in the airport vicinity. A scene starts when at least one aircraft is active or enters the threshold and ends when all aircrafts have left the vicinity or are inactive.
Data Structure
The data is grouped into five different folders. The folder titled 111_days contains the entire dataset, whereas the folders titled 7days1, 7days2, 7days3 and 7days4 contain a full week of contiguous data respectively. The contents and structure of each folder of data are shown in the example folder below:
7days1
│
└───processed_data
│   └───train
│   │   │   1.txt
|   |   |   4.txt
|   |   |   ...
│   │
│   └───test
│       │   2.txt
│       │   3.txt
│       │   ...
│
└───raw_data
    └───09-18-20_adsb
    └───09-19-20_adsb
    └───...
    └───09-24-20_adsb
        │   1.csv
The associated dates spanned by the processed data can be found by looking at the folder names within the raw_data folder. In the raw data, there is a CSV file for each day of data in the week. Within the processed data, the scenes are randomly separated into a train and test set with a 70/30 split.
Each scene is a text file with the following structure:
| Frame # | Aircraft ID | x (km) | y (km) | z (km) | windx (m/s) | windy (m/s) |
|---|---|---|---|---|---|---|
| 0 | 10620674 | 1.3407 | 0.0026 | 0.3353 | 0.0 | 0.0 |
| 1 | 10620674 | 1.3135 | 0.0021 | 0.3353 | 0.0 | 0.0 |
| 2 | 10620674 | 1.2863 | 0.0017 | 0.3353 | 0.0 | 0.0 |
| ⋮ | ⋮ | ⋮ | ⋮ | ⋮ | ⋮ | ⋮ |
| 405 | 10620674 | -3.8946 | 1.5872 | 0.9751 | 0.0 | 0.0 |
The frames are at a rate of 1 Hz. The x, y, z positions are in respect to the inertial frame centered on the end of the runway with the x axis aligned with the runway. The variable windx and windy are the wind speeds in the x and y direction.
The weather data can be found in the weather_data folder which contains a CSV file containing the weather conditions for all data spanned by the dataset. The CSV variable explanations can be found on the website for the Iowa State METAR repository.
Download
The data can be downloaded below or directly from Kilthub here where it is hosted or from the file explorer below:
Additional Info
Citation
@misc{patrikar2021predicting,
      title={Predicting Like A Pilot: Dataset and Method to Predict Socially-Aware Aircraft Trajectories in Non-Towered Terminal Airspace},
      author={Jay Patrikar and Brady Moon and Jean Oh and Sebastian Scherer},
      year={2021},
      url={https://arxiv.org/abs/2109.15158},
      eprint={2109.15158},
      archivePrefix={arXiv},
      primaryClass={cs.RO}
}
Contact
Brady Moon - bradygmoon@cmu.edu
Acknowledgments
This work is supported by the U.S. Department of Energy (Grant DE-EE0008463). This material is based upon work supported by the National Science Foundation Graduate Research Fellowship under Grant No. DGE1745016.
Thank you to the Pittsburgh-Butler Regional Airport and the employees who helped in the data collection for the past year, especially to Airport Manager Richard E. “Ike” Kelly and Maintenance Manager Chuck Ritchey.
Term of use

This work is licensed under a Creative Commons Attribution 4.0 International License.